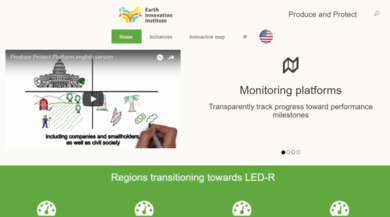
This interactive map is a component of the GCFimpact and Produce Protect Platform to facilitate tracking the performance of key jurisdictions that are on their path to a sustainable rural development.
Efficient monitoring at the territorial scale can strengthen multi-sector commitments to achieve deforestation goals and facilitate the delivery of incentives to the rural economy actors that need to make the transition to low-emission, low-deforestation production systems. We integrate credible data to create a spatio temporal dashboard to monitor and report on the jurisdictional progress towards territorial sustainability goals.
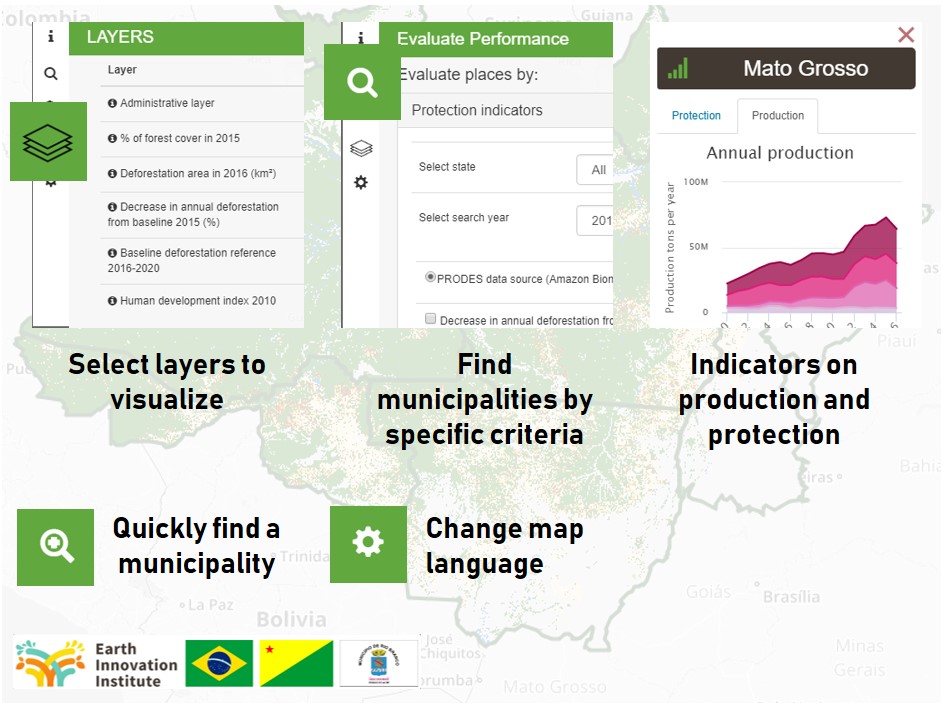
This interactive map lets you to evaluate indicators on forest protection, agricultural production, and social indicators in each of the states and municipalities of Brazil over the last years. The map focusses on the member states of the Governors' Climate and Forests Task Force
Use the available layers or define specific search criteria to identify districts performing according to your definition. Click on any district to see the production and forestry indicators on the right panel. For a detailed explanation of the platform visit our tutorial on youtube.
Select state |
|
Select search year |
|
Select state |
|
Select search year |
|
Select crop |
|
Select state |
|
Select search year |
|
Layer | State | Municipality |
---|---|---|
Administrative layer | ||
Percentage of forest cover in 2019 | ||
Deforestation area in 2019 (km²) | ||
Decrease in annual deforestation from baseline 2019 (%) | ||
Baseline deforestation reference 2016-2020 | ||
Human development index 2010 |
Language |
This interactive map is a component of the GCFimpact and Produce Protect Platform to facilitate tracking the performance of key jurisdictions that are on their path to a sustainable rural development.
This interactive map lets you to evaluate indicators on forest protection, agricultural production, and social indicators in each of the states and municipalities of Brazil over the last years. The map focusses on the member states of the Governors' Climate and Forests Task Force
Description: State and municipal administrative limits of Brazil. Simplified geometry to facilitate fast visualization on the Web.
Source: IBGE. Based on the polygons provided by the Brazilian Institute of Geography and Statistics (IBGE), Brazil
Temporality: 2017
Description: Percentage of forest cover as part of the total jurisdictional area
Source: derived from PRODES data
Temporality: 2019
Description: Deforestation area reported by PRODES in 2019. Units in square kilometers.
Source: Program for Monitoring Deforestation of the Amazon (PRODES) – National Institute of Space Research (INPE) of the Brazilian Ministry for Science and Technology.
Temporality : 2019
Description: Human development index (2010). This index includes welfare components: life expectancy, average years of education and GDP per capita.
Source: United Nations Development Program, Brazil.
Temporality: 2010
Description: Expresses the deforestation reference level (km) used to evaluate the period 2016-2020 and is estimated as the average deforestation between 1996 and 2015, as submitted by Brazil to the UNFCC
Source: derived from data of the Program for Monitoring Deforestation of the Amazon (PRODES) and the technical FREL submission of Brazil by the Ministry of Environment
Description: Expreses the percentage of deforestation reduction (or increase) respect to a baseline (deforestation reference level). For 2019 the baseline is the average deforestation measured between 1996-2015 as submitted by Brazil to the UNFCC
Source: derived from data of the Program for Monitoring Deforestation of the Amazon (PRODES) and the technical FREL submission of Brazil by the Ministry of Environment
Temporality: 2019
Description: The layer shows the Indigenous areas of Brazil
Source: Data obtained from Fundação Nacional do Índio (FUNAI)
Temporality: 2019
Description: This layer shows the extent of current forest cover (in green) and the accumulated deforestation until 1997 with yearly increments shown in reddish tones according to data measured by PRODES, Brazil. Intense red colors represent recent deforestation and light reddish colors earlier deforestation as shown in legend below.
Source: derived from data of the Program for Monitoring Deforestation of the Amazon (PRODES)
Temporality: 2019
Description: Land use and land cover map of Brazil, 2014.
Source: The geoscience division of IBGE produces a national map of landuse and landcover of Brazil published at scale 1:1000,000 using based on the interpretation of satellite images. The map has been published for the years 2000, 2010, 2012 and 2014.
Temporality: 2014
Source IBGEThis query section allows you to identify municipalities in Brazil according to forest protection indicators.
Options and Methods:
Results: After clicking on "submit" the system returns the municipalities that meet your search criteria for the selected year. Municipalities are represented by their deforestation area as shown in the legend. An interactive table of municipalities meeting the search criteria and a summary of the defined criteria is also shown.
Source: Program for Monitoring Deforestation of the Amazon (PRODES) – National Institute of Space Research (INPE) of the Brazilian Ministry for Science and Technology.
Time period: 2006-2018. Indicators are updated annualy
This query lets you identify municipalities in Brazil according to the anual agricultural area of 20 different crops.
Results: after clicking on "submit" button the system returns the municipalities that meet your search criteria for the selected year. Municipalities are represented by their harvested area as shown in the legend (units in hectares). An interactive table of municipalities meeting the search criteria and a summary of the defined criteria is also shown.
Source: Brazilian Institute of Geography and Statistics (IBGE), Brazil.
Time period: 2006-2018. Indicators are updated annualy
This query lets you identify municipalities in Brazil according to the annual cattle herd size.
Results: after clicking on "submit" button the system returns the municipalities that meet your search criteria for the selected year. Municipalities are represented by the cattle headcount. An interactive table of municipalities meeting the search criteria and a summary of the defined criteria is also shown.
Source: Brazilian Institute of Geography and Statistics (IBGE), Brazil.
Time period: 2000-2018. Indicators are updated annually
Descripción: En México no establece una delimitación oficial de territorios indígenas y los polígonos presentados en esta capa fueron elaborados por Eckart Boege a partir de la auto adscripción en los hogares indígenas en el censo de población 2010
Fuente: Comisión Nacional para el Desarrollo de los Pueblos Indígenas (CDI), México
Temporalidad: 2010
Description: The layer contains federal and state conservation units of the Brazilian Amazon.
Source: Data obtained from Ministry of Environment of Brazil
Temporality: 2017